Activity Statistics
The "Activity Statistics" page is divided into two tabs:
The "Activity Statistics" page is divided into two tabs:
- Report Statistics - Show usage statistics for reports.
- Entity Statistics - Show usage statistics for entities.
To change the time period for which you are seeing the statistics, under the tab's name, select Statistics Time and then select the desired value. Fore example, 6M for six months.
The reports and entities are listed in a table on the left. To change for which report or entity you are viewing statistics, select another report or entity from the table.
For both tabs, you can see a list of users and when they interacted with the report or entity. You can also see the report page view data in the Report Statistics tab.
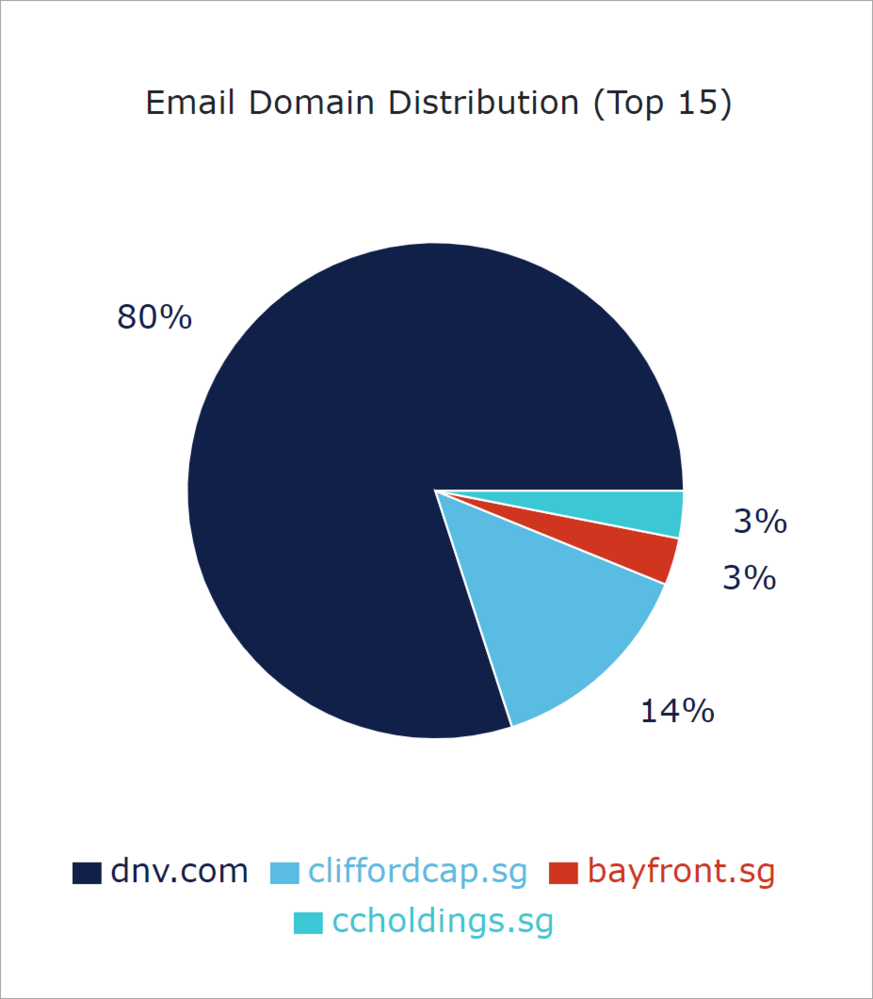
To see the list of users and the time when they interacted with the report or entity, in Report Statistics or Entity Statistics, under Email Domain Distribution, select (click) the chart. This will open a pop-up window with the list of the users and the time they interacted with the report.
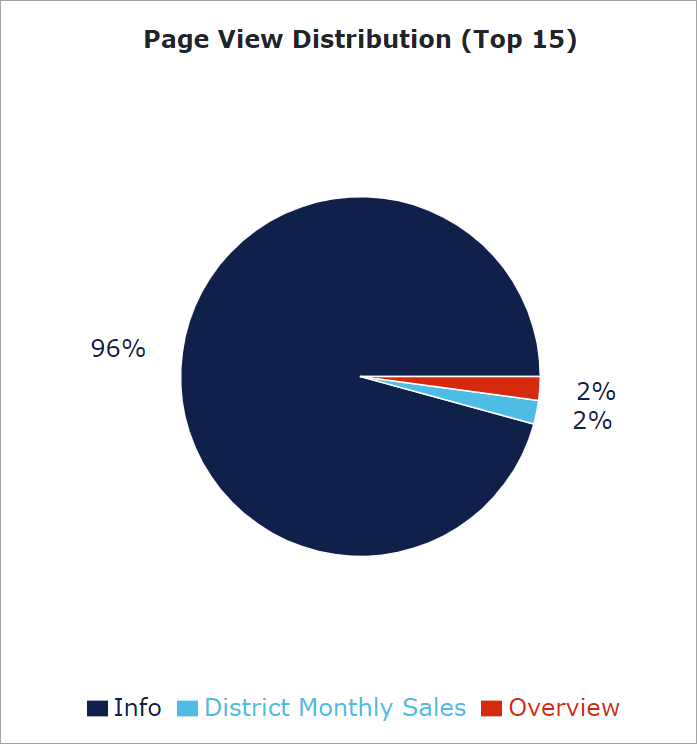
To see the number of users who interacted with the report page, in Report Statistics, under Page View Distribution, select the chart. This will open a pop-up window with the number of page views and the time of the last view.
Note that if a web report has no page views or no access history for a report, the Page View Distribution will not be displayed.
Below is a sample Email Domain Distribution chart.
Below, you can see a sample Page View Distribution chart.